Most traders struggle because they chase breakouts, react to headlines, or jump into trades based on emotion.
The result?
Inconsistent performance, blown-up accounts, and a constant feeling of uncertainty.
Now…
What if there’s a way to profit by understanding the market’s tendency to snap back to its average?
That’s the power of mean reversion trading.
It’s a trading strategy that works because markets often overreact in the short term before correcting themselves.
By systematically capturing these swings, you can generate consistent returns without relying on guesswork.
That’s why in today’s article, you’ll discover:
- What mean reversion trading is (how and why it works)
- The secrets of mean reversion trading success
- A mean reversion trading system that has generated 2834% over the last 25 years
- Data and backtest results
- Pros and cons of mean reversion trading
Mean reversion trading explained
Mean reversion trading is based on a simple idea: when the price makes an extreme move, it tends to snap back towards the historical average.
This means a mean reversion system would buy when a stock is oversold and sell it on the next bounce higher.
Yet you might be wondering…
“Why does mean reversion trading work?”
It’s because the market often overreacts to the news, which causes the price to drop more than it should. But once emotion cools, the price tends to move back towards its fair value.
This creates trading opportunities for a mean reversion trader to “buy low and sell high”—the same strategy my wife uses when she goes shopping!
Now, before I give you the rules of the mean reversion trading system, you first need to understand the principles behind it so you know how it works.
6 principles of mean reversion trading
1. Identify stocks in an uptrend
Stocks in an uptrend are likely to continue higher. It could be due to solid fundamentals, positive sentiment, a well-managed company, etc. You don’t need to know the exact reason. After all, who has time to scrutinise the fundamentals?
I barely have time to read the instructions on my shampoo bottle, which explains a lot about my hair situation.
2. Wait for a pullback
A stock doesn’t go up in one straight line. Instead, it moves higher, pulls back, and then resumes its upward trend. As a mean reversion trader, you always buy on the dip, not on the rally.
3. Buy when it’s oversold
You’re probably wondering…
“How do I know when a stock is oversold?”
Visually, it looks like a big fat red candle on the chart. Sometimes, there are even multiple red candles in a row—like my credit card bills after my wife’s online shopping sprees.
The more bearish it looks, the more oversold it is. However, this can be subjective. That’s why later, you’ll learn a specific trading rule to define when a stock is oversold.
4. Sell the rally
A mean reversion system looks to capture a swing (or one move). This allows you to generate consistent profits and have a high winning rate.
5. Trade multiple stocks
Anything can happen to a single stock. A company could turn out to be fraudulent and its stock price could go to zero. That’s why you shouldn’t allocate all your capital to a single position.
Instead, spread your bets across multiple stocks so you reduce your risk and have a higher chance of making a profit. It’s like having multiple kids—if one disappoints you, you’ve still got backup.
(Just kidding, all of my children are perfect… if you’re reading this.)
6. Focus on large market capitalization stocks
Mean reversion trading works better on large-cap stocks because they are widely followed by institutions and analysts. This means most of the time, the price movement is short-term noise and not a big fundamental change. This “noise” is what allows a mean reversion trading system to thrive.
These six principles form the backbone of mean reversion trading. But principles alone aren’t enough— you need clear objective trading rules.
That’s why I’ll now walk you through the rules of a mean reversion trading system (backed by data)…
A mean reversion trading system that works
Markets traded:
Stocks in the Russell 1000 index
Timeframe:
Daily
Risk management:
20% capital for each stock and a maximum of 5 positions
Trading rules
- The stock is above the 200-day moving average (criteria to define an uptrend).
- The stock closes below the lower Bollinger Band (criteria to define the pullback).
- Place a 3% buy limit order (criteria to identify oversold stocks).
- If your order is filled, sell when the 2-day RSI crosses above 50 or after 10 trading days (criteria to define the sell signal).
- If there are too many stocks to choose from, select the ones that have increased the most in price over the last 150 days (criteria to rank stocks from strongest to weakest).
* Bollinger Band settings: 20-day moving average and 2.5 standard deviation
Here’s an example…
Kirby Corporation (Kex)
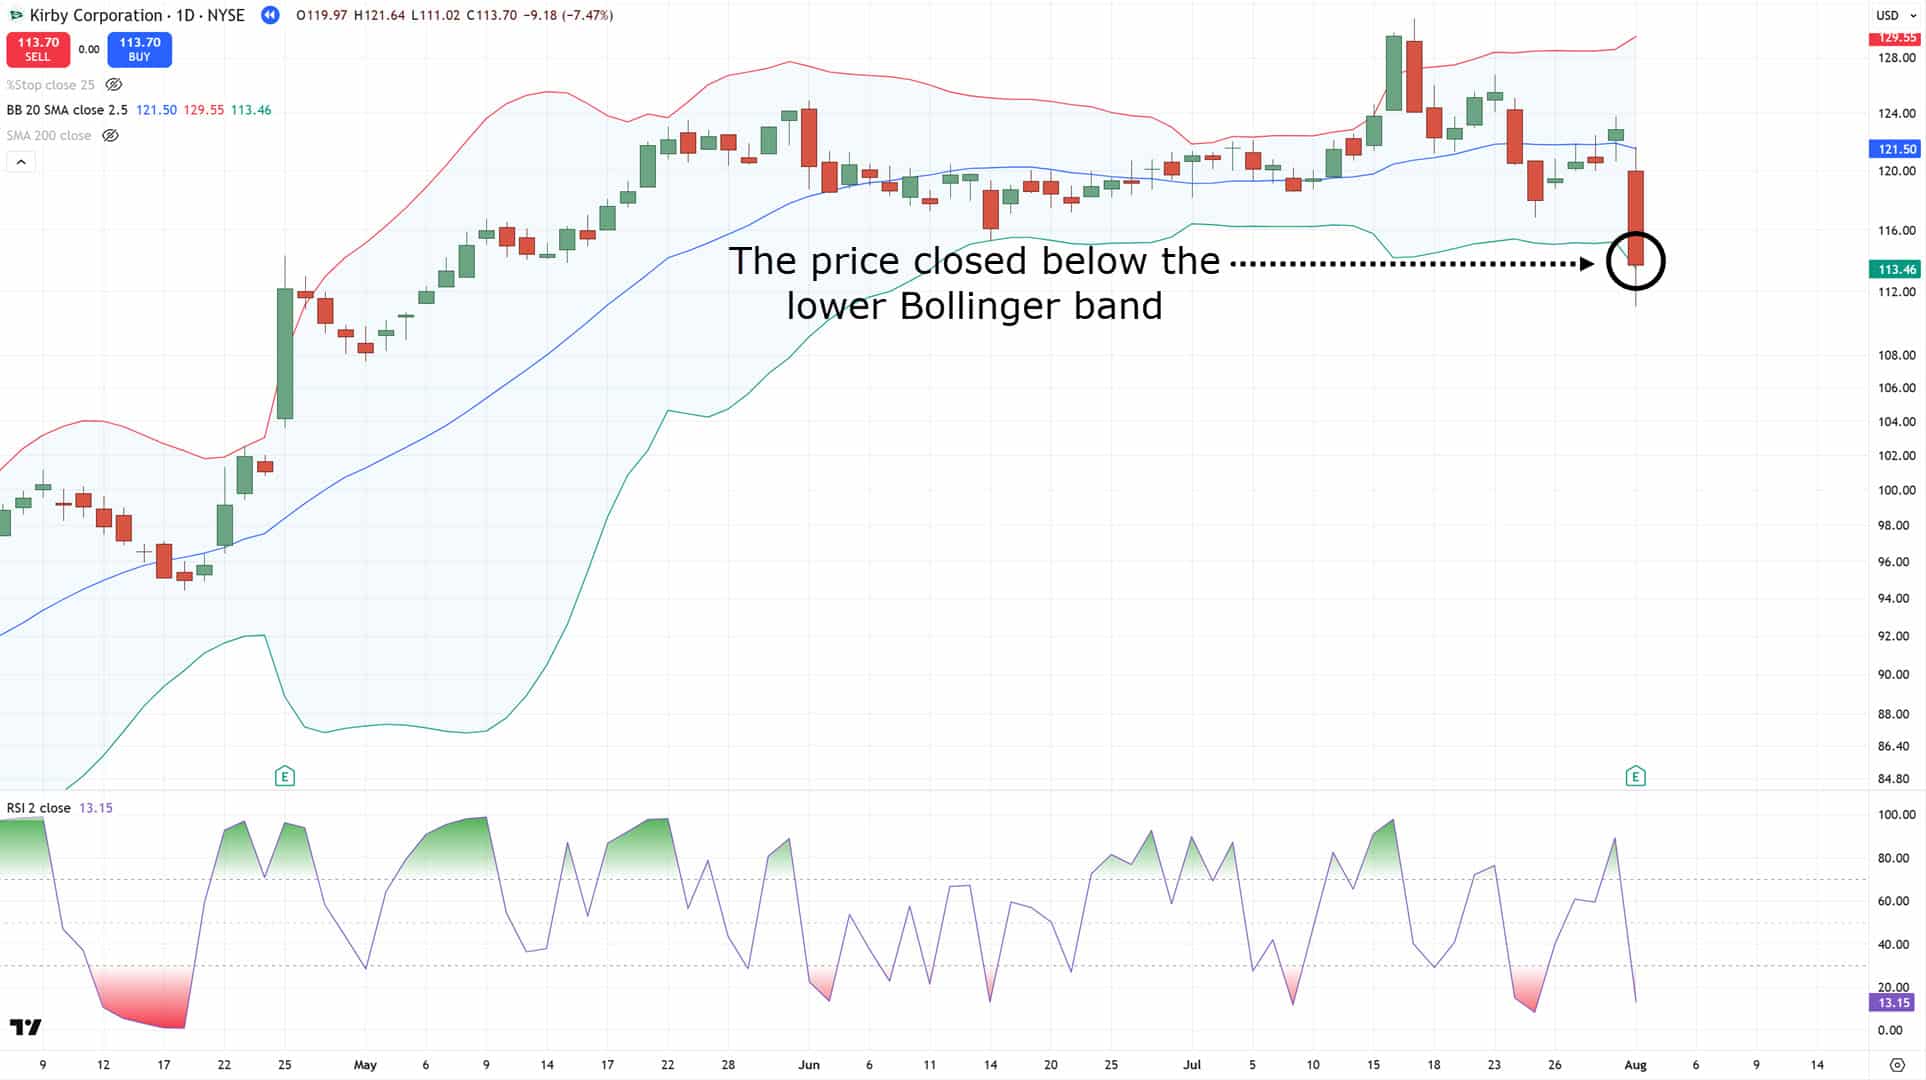
Kex is in an uptrend as the stock price is above the 200-day moving average.
On 1st August 2024, the stock made a pullback and closed below the lower Bollinger band.
The next day, the stock price traded lower and would have filled your buy limit order.
Two days later (on 6th August), the 2-day RSI crossed above 50 (which is the exit signal). This means you would exit the position for a profit of 2.5% on this trade.
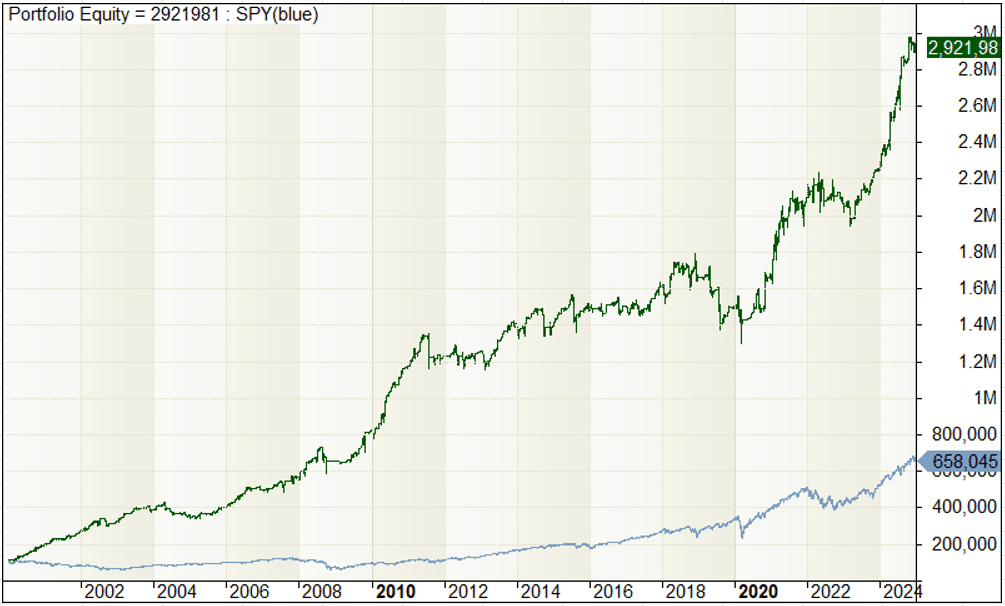
Backtest results: Mean reversion trading system
Here’s the result over the last 25 years…
- Total return: 2821% (since 2000)
- Annual return: 14.47%
- Winning rate: 66.16%
- Losing rate: 33.84%
- Payoff ratio: 0.77 (average profit / average loss)
- Maximum drawdown: 27.43%
Here’s the equity curve of the trading system…
And the yearly returns…
 mean reversion trading")
Pros and cons of mean reversion trading
First, the advantages of mean reversion trading…
Advantages of mean reversion trading
- High winning rate
- Makes money in most years
Mean reversion trading systems are quick to take profit (faster than I grab the last piece of cake before anyone notices). This explains the high winning rate (above 60%), which is psychologically easier for most traders to handle.
It makes a profit when the overall market condition is bullish or range-bound. And since the stock market is generally in a long-term uptrend, it makes money in most years.
Next, the disadvantages…
Disadvantages of mean reversion trading
- Average loss is larger than average profit
- Underperforms during a bear market
Sometimes, the stocks you buy don’t make a bounce and continue to decline for many days in a row. Such losses could erode the gains of multiple winning trades.
During a bear market, most stocks will be in a steep decline. A mean reversion trading system is vulnerable during these declines, since it only profits when a stock makes a bounce higher. In a bear market, the bounce might never come or happen at a much lower price.
So now the question is…
Is mean reversion trading suitable for you?
Here’s my take on it…
Mean reversion trading is NOT for you if…
- You can’t afford the time to place trades every day.
- You want your average profit to be larger than your average loss.
- You want returns not correlated to the stock market.
Mean reversion trading is FOR you if…
- You’re willing to place trades every day.
- You can accept that your average loss is larger than your average profit (like how I’ve accepted my hair is abandoning ship faster than passengers on the Titanic.).
- You want a high winning rate so it’s easier on your trading psychology.
Now, you have a good idea whether mean reversion trading suits your personality and goals.
Still, you might have a few questions. So let’s tackle some of the common ones I get from traders…
Frequently asked questions
Mean reversion trading vs trend following, which is better?
These are two different trading strategies.
A mean reversion trading approach has a higher winning rate, but the average loss is larger than the average profit. Like dating someone who compliments you daily but occasionally maxes out your credit card.
A trend following approach has a lower winning rate, but the average profit is larger than the average loss. Like that friend who rarely calls but always brings expensive whiskey when they visit.
Essentially, the “best” approach depends on your goals, as what works for one trader may not suit another.
Does mean reversion trading still work today?
Yes, mean reversion trading still works even today (as you can see from the backtest results).
However, the edge has gotten smaller in recent years.
What markets does mean reversion trading work on?
I’ve tested it on large market capitalization stocks, and it works. I’ve also seen it applied successfully in the crypto markets. However, I didn’t find success with smaller market capitalization stocks.
Can mean reversion trading work for the short side?
Yes, the approach can work for shorting stocks. But you need different trading rules for it.
Conclusion
Markets revert to their mean, like how I always return to my refrigerator, no matter how many diets I start.
Mean reversion trading is about exploiting the tendency of prices to swing back toward their average. By identifying these opportunities, you can profit from short-term mispricings in the stock market.
This trading strategy performs well in a bull and range-bound market, but faces challenges in a bear market. That’s why risk management, position sizing, and system rules are critical to long-term success.
Anyway, if you want to learn how to implement a mean reversion trading system for your portfolio, then check out The Ultimate Systems Trader. It’s a 1-year coaching program that shows you how to earn an extra 15% a year in 15 minutes a day, so you can generate another source of income.