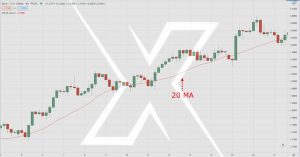
What is the 20 day moving average and how does it work?
The moving average indicator calculates the average price over a given period.
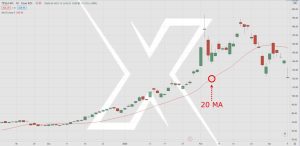
So for a 20 day moving average, it calculates the average price over the last 20 candles.
Here’s how it looks like…
Now you’re wondering:
“How does the moving average indicator work?”
Let me explain…
Imagine Stock ABC has the following closing prices for each of the last 20 days…
$1, $2, $3, $4, $5, $6, $7, $8, $9, $10, $11, $12, $13, $14, $15, $16, $17, $18, $19, $20
So, what’s the average price over the last 20 days?
Well, you need to add each of the prices of the last 20 days and divide by 20.
This gives you…
[1 + 2 + 3 + 4 + 5 + 6 + 7 + 8 + 9 + 10 + 11 + 12 + 13 + 14 + 15 + 16 + 17 + 18 + 19 + 20] / 20= 10.5
This means that the 20 day moving average value is $10.5.
Now…
If stock ABC closes at $30 on the 21st day, what’s the 20 day moving average?
Again, we’ll add the 20 most recent closing prices and divide them by 20.
This gives you…
[2 + 3 + 4 + 5 + 6 + 7 + 8 + 9 + 10 + 11 + 12 + 13 + 14 + 15 + 16 + 17 + 18 + 19 + 20 + 30] / 20= 11.95
This means the 20 day moving average value is $11.95.
Now you might be wondering…
“How does the 20 day moving average become a line on the chart?”
I’ll explain…
A 20 day moving average value will show up as a “dot” on the chart.
As new prices are formed, the 20 day moving average is re-calculated and it will show up as a new “dot” on the chart.
When you connect the “dots”, it becomes a line on your chart.
Does the 20 moving average make sense?
Great!
Let’s move on…
How to use the 20 day moving average to spot high probability breakout trades (before it occurs)
Here’s the deal:
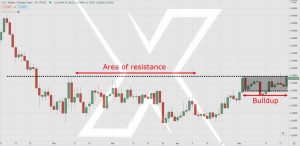
If you want to find low-risk and high-reward breakout trading opportunities for this 20-period moving average strategy, then you must look for breakouts with a buildup—a tight consolidation that forms before the breakout.
Here’s an example…
You’re wondering:
“Why is a buildup so special?”
Here’s why…
#1: It’s a sign of strength
When there’s a buildup formed, it means buyers are willing to buy at higher prices (even in front of resistance).
This is a sign of strength signalling the market could break out higher.
#2: Favorable risk-to-reward
If you trade “normal” breakouts, your stop loss usually goes below the low of the range (or support).
As you can imagine, that’s a darn wide stop loss level.
But if you trade breakouts with a buildup, then you can reference the low of the buildup to set your stop loss.
This reduces the size of your stop loss, allows you to put on larger position size, and improves your risk-to-reward on the trade.
So now, you’ve understood the importance of a buildup.
But how do you identify one correctly?
Well, you can eyeball your chart and look for buildup that’s forming.
Alternatively, you can use the 20 day moving average to help you with it (which is my preferred method).
Here’s how…
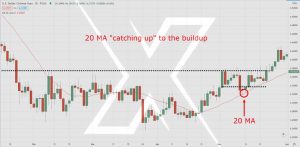
- Let the price approach resistance
- Wait for the 20 day moving average to “catch up” to the low of the buildup
- Buy the breakout when the price breaks above resistance and if the price is above the 20 moving average
Here’s an example…
You’re thinking:
“Does it mean buildup is only used when the market is ranging?”
Nope.
Because you can also apply the same concept to a trending market which is what I’ll cover next…
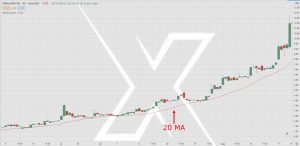
20MA trend continuation breakouts
Look at this chart below…
To a new trader, it seems difficult to catch a piece of the move.
But if you understand the concept of a buildup, then it’s a different story.
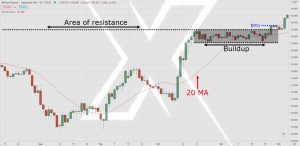
Here’s how it works for a trending market…
- Identify a trending market
- Let the price form a buildup
- Allow the 20 day moving average to catch up with the buildup
- Buy the breakout when the price breaks above the buildup
An example:
This 20-period moving average strategy is pretty powerful, right?
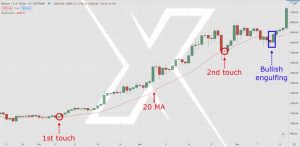
20 day moving average: How to time your pullback entry with precision
In a strong trending market, the depth of the pullback is short—which can be difficult to time your entry if you don’t know what to look for.
That’s why in such a market condition, the 20 day moving average is useful because it can react fast enough even on a short pullback.
Here’s how it works…
- Identify a trending market that has bounced off the 20 day moving average at least twice
- Wait for a pullback towards the 20 day moving average
- Look for a bullish price rejection around the 20 day moving average
- Go long on the next day’s open
Here’s an example…
Also read: The Moving Average Trading Strategy Guide
At this point, you might be thinking about the moving average 20…
“Is it better to use the 20 day moving average or 30-day moving average?”
Here’s the deal:
There’s no best moving average out there because the concept is what matters.
Let me give you an example…
In a strong trending market, you can use the 20 day moving average to time your entry on a pullback.
But if you choose to go with the 30-day moving average, would it matter much?
Take a look for yourself…
This is the 20 day moving average (red line)
This is the 30-day moving average (purple line)
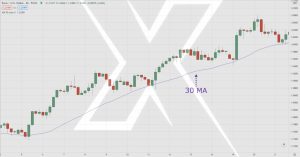
As you can see…
Sometimes the price respects the 20 day moving average better, and sometimes the 30-day moving average.
But if you look at the big picture, it doesn’t make much of a difference between the moving average 20 and 30.
And that’s the point I want to make—the concept is what matters, not finding the best moving average settings or whatsoever.
Cool?
Conclusion
So here’s what you’ve learned:
- The 20 day moving average is an indicator that calculates the average price over the last 20 candles
- You can use the 20 day moving average to trade breakouts. Allow the 20 day moving average to “catch up” to the low of the buildup before buying the breakout (the same concept applies to a trending market)
- In a strong trending market, the price could find support at the 20 day moving average. You can enter near the moving average after a bullish price rejection
- There’s no such thing as best moving average because it doesn’t exist—the concept is what matters
Now here’s what I’d like to know…
How do you use the 20 day moving average in your trading?
Leave a comment below and share your thoughts with me.
When you’re ready, here are 3 ways I can help you…