Do you want to learn how to use the 10-day moving average like a pro?
Then today’s post is for you.
You’ll learn:
- What is the 10-day moving average and how does it work
- How to use the 10-day moving average to capture quick profits in fast-moving markets
- The moving average 10 inside bar breakout
- How to use the 10-day moving average to time your exit so you don’t give back all your open profits
Interested? Then let’s get started!
What is the 10-day moving average and how does it work?
The moving average indicator calculates the average price over a given period.
So for a 10-day moving average, it calculates the average price over the last 10 candles.
Here’s what it looks like…
Now you’re wondering:
“How does the 10-day moving average work?”
Let me explain…
Imagine Stock ABC has the following closing prices over the last 10 days…
$1, $2, $3, $4, $5, $6, $7, $8, $9, $10
So, what’s the average price over the last 10 days?
Well, you need to add the prices over the last 10 days and divide by 10.
This gives you…
[1 + 2 + 3 + 4 + 5 + 6 + 7 + 8 + 9 + 10] / 10= 5.5
This means the 10-day moving average value is 5.5.
Now…
If stock ABC closes at $20 on the 11th day, what’s the 10-day moving average?
Again, we’ll add the 10 most recent closing prices and divide them by 10.
This gives you…
[2 + 3 + 4 + 5 + 6 + 7 + 8 + 9 + 10 + 20] / 10= 7.4
This means the 10-day moving average value is 7.4.
Now you might be wondering…
“How does the 10-day moving average become a line on the chart?”
I’ll explain…
A 10 day EMA value will show up as a “dot” on the chart.
As new prices are formed, the 10-day moving average is re-calculated and it will show up as a new “dot” on the chart.
When you connect the “dots”, it becomes a line on your chart.
Does it make sense?
Great!
In the following section, you’ll learn how to use the 10-day moving average to profit in bull & bear markets.
Read on…
How to use the 10-day moving average to capture quick profits in fast-moving markets
The 10 day moving average strategy is a short-term moving average as it only considers the latest 10 candles on the chart.
So, what can you do with such a short-term moving average?
For starters, this is useful if you want to capture quick profits in fast-moving markets
Here’s how…
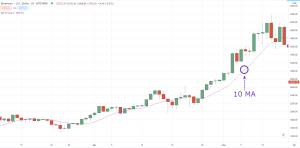
- Identify a strong trending market that respects the 10-day moving average
- Allow the market to pullback towards the 10-day moving average
- Wait for a bullish price rejection and enter on the next candle’s open
(And vice versa for a downtrend)
Let me explain in more details…
#1: Identify a strong trending market that respects the 10-day moving average
You’re wondering:
“What do I mean by respect?”
“Yes, we respect our elders. But a moving average? What?”
This means the 10 day moving average strategy is acting as an area of value where buyers could step in to push the price higher.
One tell-tale sign is when the market has bounced off the 10-day moving average at least twice.
Here’s an example…

Next…
#2: Allows the market to pullback towards the 10-day moving average
Now, just because the market is trending higher doesn’t mean you quickly hit the buy button.
Why?
Because it could be due for a pullback or complete reversal.
That’s why we want to trade from an area of value, and in this case, the 10 moving average.
So, be patient and let the market come to you.
And then…
#3: Wait for a bullish price rejection and enter on the next candle’s open
Why?
That’s because you’ve no idea if the price will still respect the 10-day moving average or break through it.
So, let’s wait for a bullish price rejection (like a hammer, bullish engulfing pattern, etc.) to “confirm” our hypothesis.
Then, you’ll enter on the next candle’s open.
Here’s how it looks like…

Moving on…
The 10MA inside bar breakout
Look at this chart below…

You’ll notice the price “grinding” higher without making a pullback—which makes it difficult for you to time your entry.
The solution?
Introducing the inside bar breakout.
Here’s how it works…
As the price is grinding higher, it could make a quick pullback from the 10 moving average period in the form of an inside bar.
You’re wondering:
“What’s an inside bar?”
This is a price pattern where the range of the current candle is contained within the range of the previous candle.
An example:

This signals indecision as both the buyers and sellers are in equilibrium.
But since we are trading in a strong uptrend (which is determined by using a moving average 10 period), the market is likely to continue higher after the breakout of the inside bar.
So a simple entry technique is to place a buy stop order above the highs of the inside bar.
In other words, you will go long when the market breaks above the high of the inside bar.
Here’s an example of the inside bar breakout…

At this point:
You’ve learned how you can use the 10-day moving average to better time your entries in fast-moving markets.
But now the question is…
Also read: The Moving Average Trading Strategy Guide
How do you know when to get out of trade so you don’t give back all your profits?
Here’s the thing:
When the market is trending strongly, the 10-day moving average can act as an area of value.
(That’s how we use it to time our entry earlier.)
So as long as the price remains above the 10-day moving average, you can hold on to the trade and ride the move for as long as it lasts.
But when the price breaks below it, then you’ll exit your trade.
That’s because the 10-day moving average no longer acts as support and the market could make a deeper pullback (or a complete reversal).
Here’s an example:

And vice versa for a market in a strong downtrend…

Conclusion
So here’s what you’ve learned…
- The 10 day EMA period is an indicator that calculates the average price over the last 10 candles
- In fast-moving markets, the price could find support at the 10-day moving average. You can enter near the moving average after a bullish price rejection or an inside bar breakout.
- You can trail your stop loss using the 10-day moving average to ride the short-term trend
Now here’s what I’d like to know…
How do you use the 10-day moving average in your trading?
Leave a comment below and share your thoughts with me.
You may also be interested in reading:
When you’re ready, here are 3 ways I can help you…